06 Nov Graphic info (as in infographics!)
These days information overload seems like an understatement, and it is becoming increasingly challenging as designers and marketing folk to help people and organizations communicate key information to their audiences in a way that is engaging and enhances retention.
However, if 90% of the information that is transmitted to the brain is visual, and we remember up to 80% of visual information (vs. 20% of what we read, vs. 10% of what we hear) infographics offer a great way to stand out in that great big sea of endlessly streaming data!
Here are some of the recent infographics we’ve created for clients:
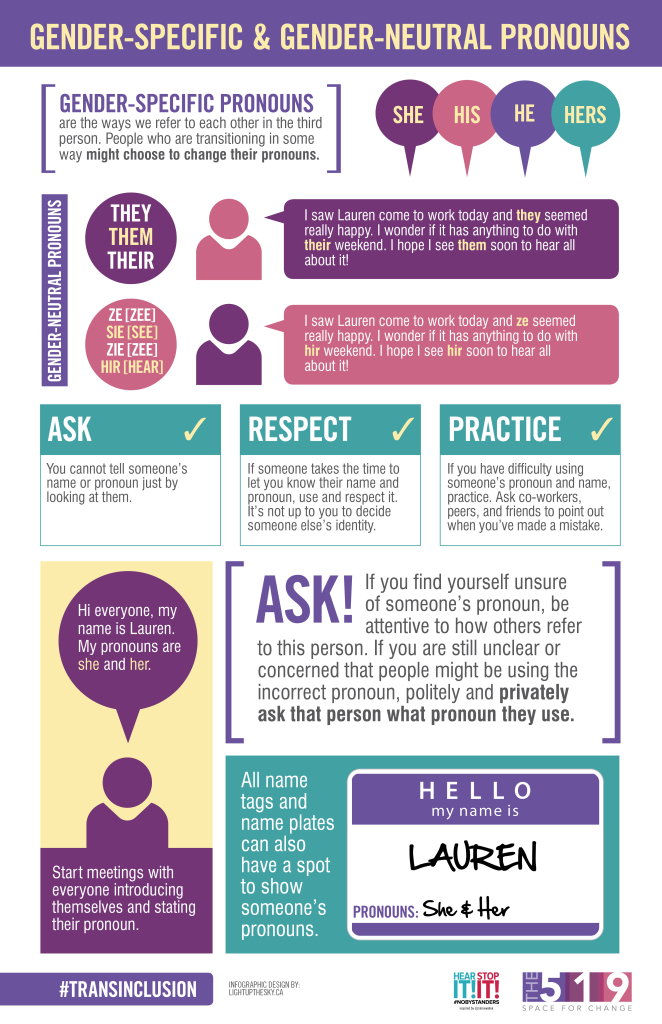
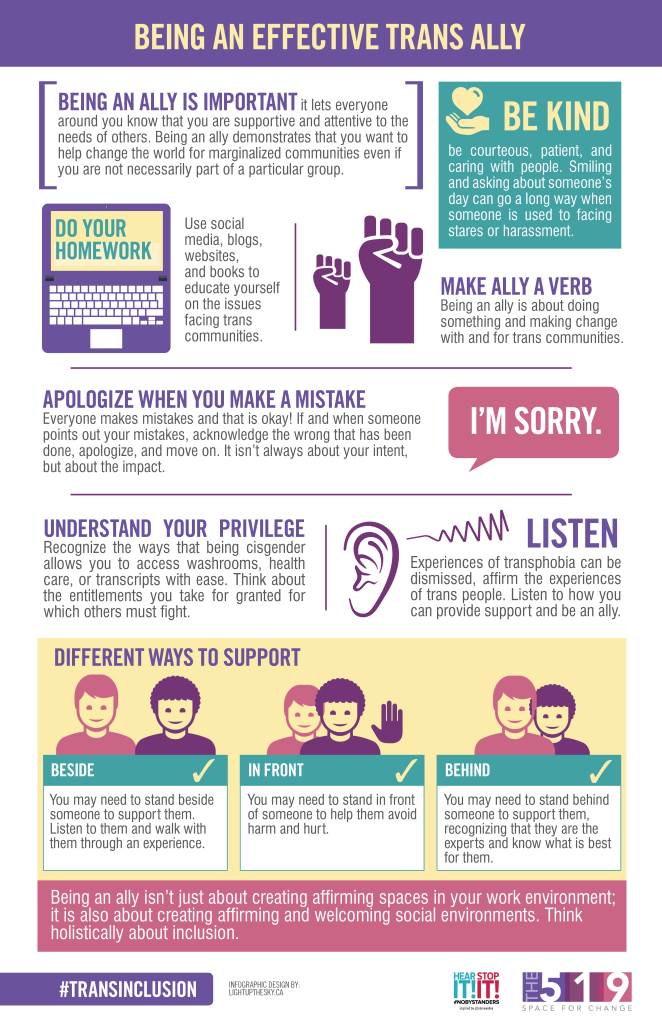
We worked with The 519 to create some educational infographics about Trans rights, being a good Trans ally and creating authentic spaces.
You can download these resources for free from The 519’s website.
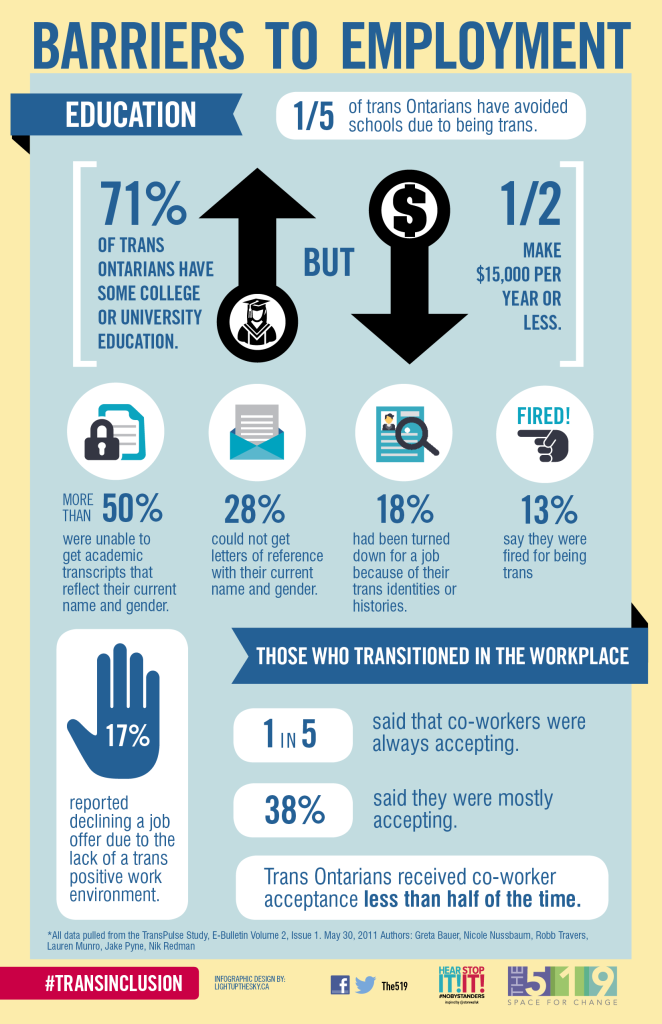
We also worked with The 519 to develop a series of educational infographics that call out some of the barriers that Trans folks experience.
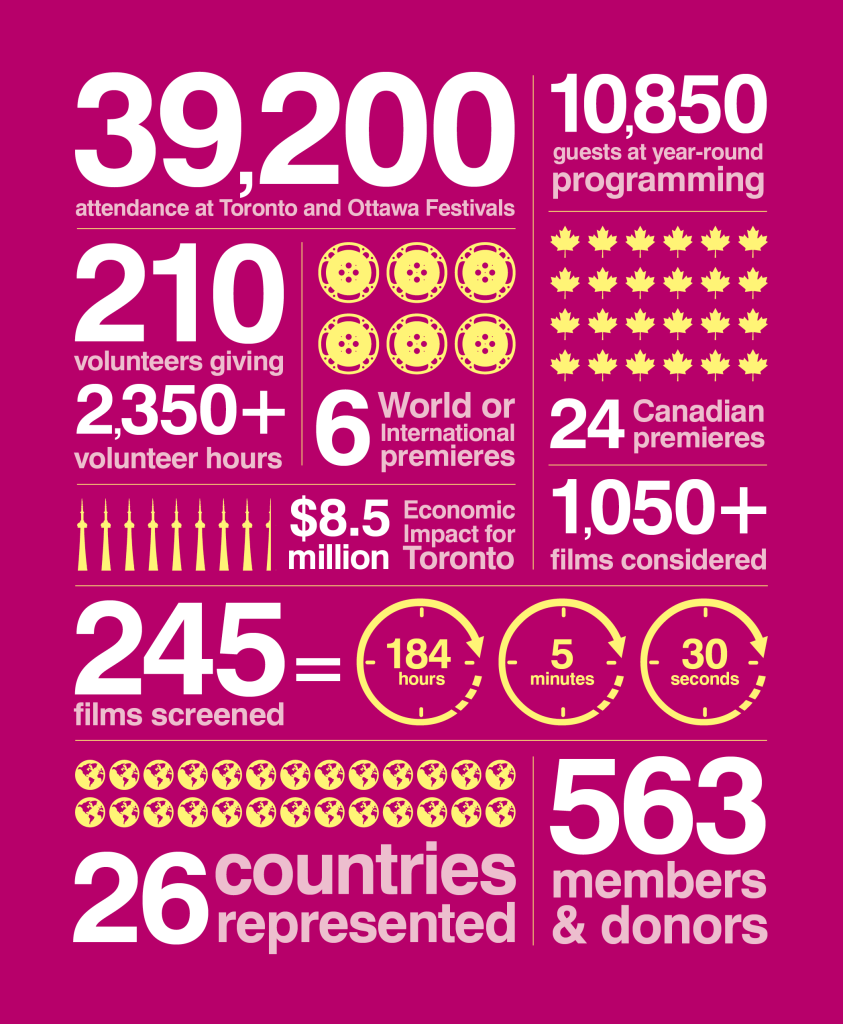
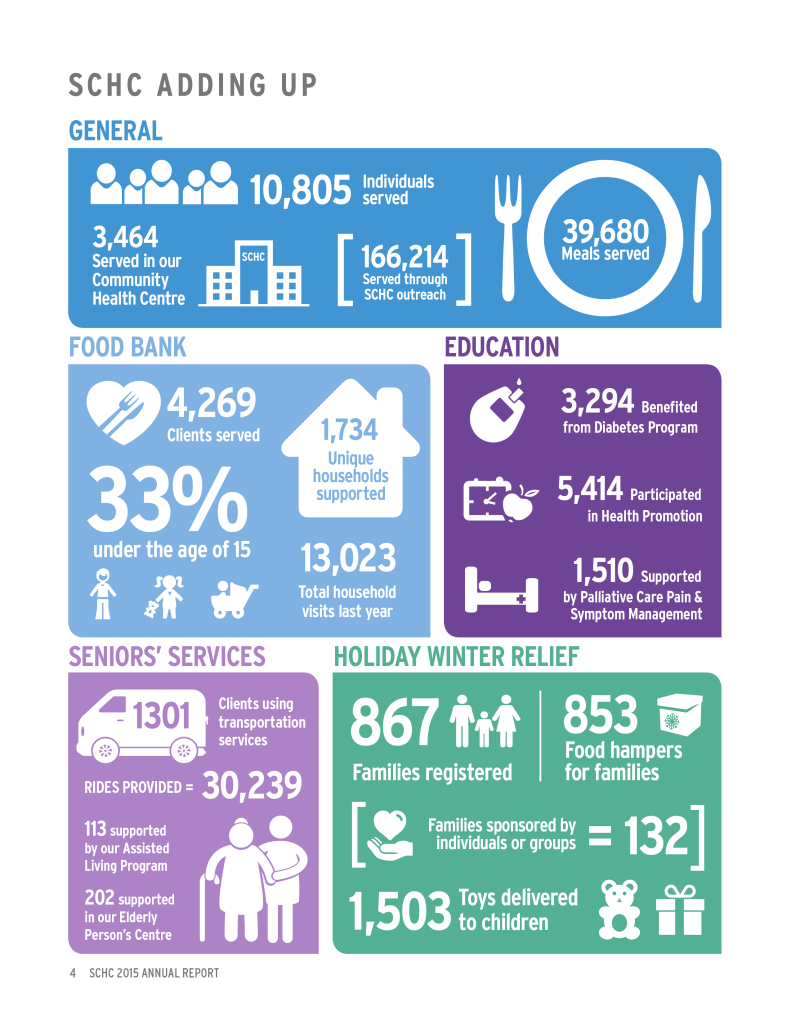
Infographics are also a great way to summarize stats in client’s Annual Reports. Here are two examples we designed for LBGT film fest Inside Out, and one for Scarborough Centre for Healthy Communities.


No Comments